1. Introduction
In the Nepalese stock market, the 15% daily circuit limit is applied to individual listed stocks, not the NEPSE index. This distinction is critical, yet often misunderstood by investors.
While the index reflects overall market movement, price restrictions operate at the stock level, creating unique dynamics in volatility, liquidity, and trading behavior—especially under the T+2 settlement system.
This article presents a mathematical breakdown of circuit movement, highlights hidden asymmetry, and explains practical trading strategies for real market conditions.
2. Mathematical Structure of Stock-Level Circuit
Assume an individual stock with:
- Previous Closing Price = 100
Then:
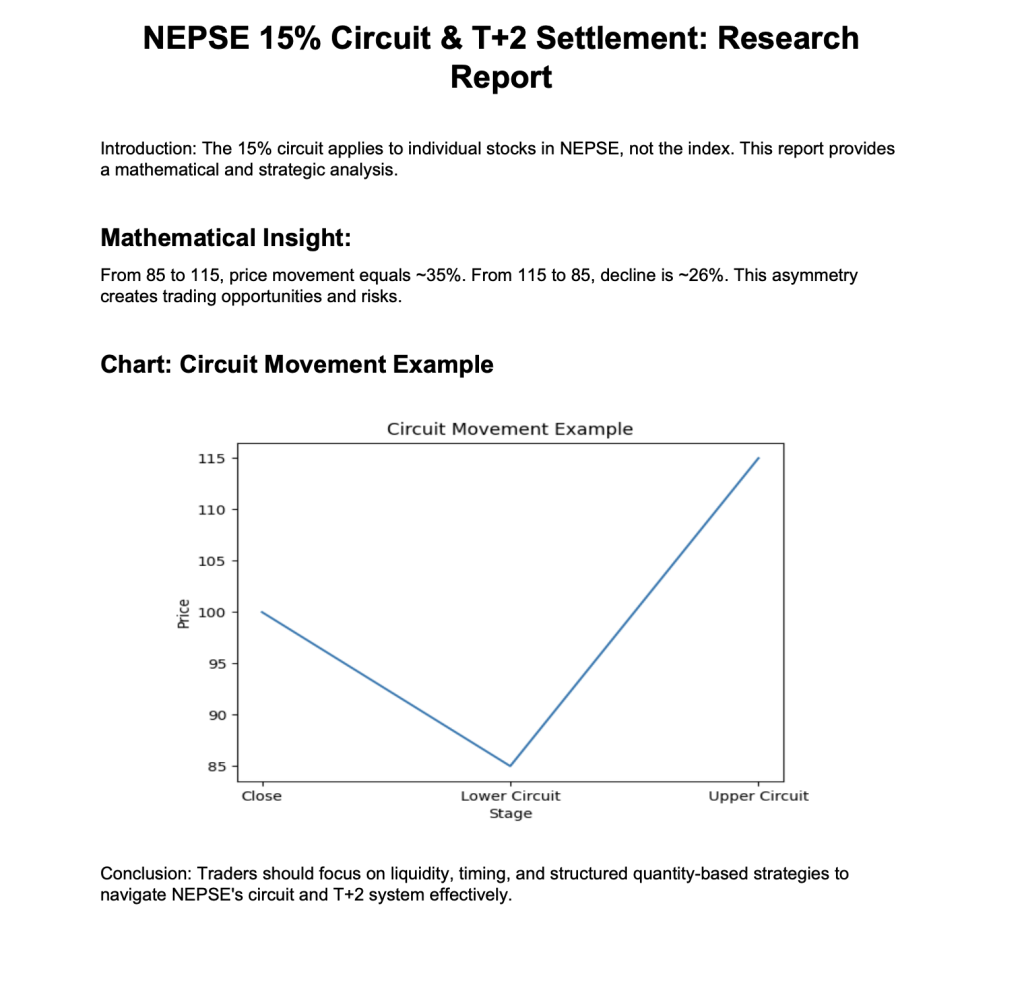
- Lower Circuit Limit = 85
- Upper Circuit Limit = 115
This defines the maximum allowed daily movement for that specific stock, regardless of overall index movement.
3. Case 1: Stock Falls First, Then Rebounds
If a stock hits the lower circuit (85) and later reaches the upper circuit (115):
Growth %=115−8585×100\text{Growth \%} = \frac{115 – 85}{85} \times 100Growth %=85115−85×100
≈ 35.29% gain
Insight:
Even though the circuit limit is 15%, actual tradable movement within the same range can exceed 35%.
4. Case 2: Stock Rises First, Then Falls
If a stock reaches 115 and later drops to 85:
Decline %=115−85115×100\text{Decline \%} = \frac{115 – 85}{115} \times 100Decline %=115115−85×100
≈ 26.09% loss
Insight:
Downside appears smaller in percentage terms—but this does not reduce actual risk.
5. Asymmetry in Circuit Movement
- 85 → 115 = +35%
- 115 → 85 = −26%
Key Observation:
The market is mathematically asymmetric within the same circuit band.
However, in real trading:
- Gains depend on entry timing
- Losses are often amplified by liquidity constraints
6. Risk in Highly Volatile Stocks
Since circuits apply to individual stocks, volatility can vary significantly across the market.
Critical Risks:
1. Liquidity Collapse
- Continuous lower circuit → no buyers
- Investors cannot exit positions
2. Price Free Fall Across Days
Example:
- Day 1: 100 → 85
- Day 2: 85 → 72.25
Total drop ≈ 28% in 2 days
3. Leverage Risk
- Margin positions trigger forced selling
- Accelerates downward pressure
7. Impact of T+2 Settlement
Under T+2:
- Funds from selling → available after 2 days
- Shares bought → delivered after 2 days
Market Effect:
- Capital gets temporarily locked
- Traders cannot instantly re-enter
- In falling markets, this delay increases risk
8. Practical Trading Strategy: Rolling Quantity Model
Despite T+2 constraints, traders can maintain daily activity using structured allocation.
Example Strategy:
If a trader holds 300 shares:
- Day 1 → Trade 100 shares
- Day 2 → Trade 100 shares
- Day 3 → Trade 100 shares
Benefits:
- Maintains daily trading ability
- Reduces timing risk
- Improves capital rotation
9. Capital vs Quantity Relationship
Trading capacity depends on stock price:
- High-priced stocks → Lower quantity
- Mid-range stocks (300–400) → Optimal balance
- Low-priced stocks → Higher quantity possible
Example:
- Rs. 300–400 stock → ~3000 shares
- Daily trading → ~1000 shares
10. When NOT to Trade
Avoid:
- Stocks hitting continuous lower circuits
- Illiquid stocks with low demand
- High leverage in falling markets
👉 In such conditions, mathematics becomes irrelevant—liquidity dominates.
11. Positive Side: Opportunity in Stock-Level Volatility
Because circuits apply individually:
- Some stocks may hit upper circuit while others fall
- Creates stock-specific opportunities
Advantages:
- High volatility = High return potential
- Multiple trading ranges within same stock
- Ideal for active traders
12. Key Market Insight
A 15% circuit does not mean limited opportunity.
👉 It creates:
- Up to 35% effective movement range
- Both profit potential and capital risk
13. Conclusion
The 15% circuit system in NEPSE:
Risks:
- Liquidity traps in individual stocks
- Delayed settlement (T+2)
- Forced selling in volatile conditions
Opportunities:
- Large price swings within defined range
- Structured trading strategies
- Stock-specific alpha generation
Final Takeaway
- Focus on stock selection, not just index direction
- Prefer neutral or defensive stocks in uncertain markets
- Use quantity-based trading strategies
- Understand that liquidity + timing > pure mathematics
Leave a Reply