What is an Inside Bar?
In the world of trading, patterns often tell a story. One such powerful and reliable story is told by the Inside Bar pattern.
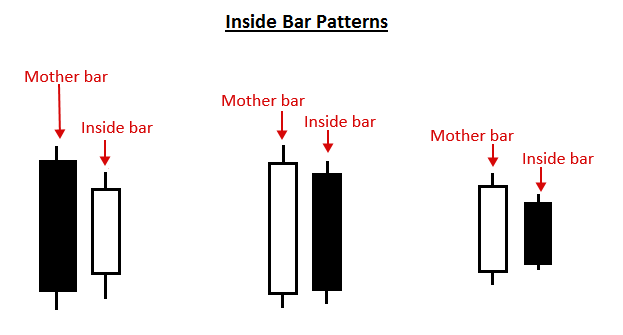
An Inside Bar forms when the high and low of the current candle are completely contained within the range of the previous candle. In simple terms, the current bar is “inside” the previous bar. This means the high of the current candle is lower than the high of the previous one, and its low is higher than the previous low.
This pattern reflects a moment of consolidation and indecision in the market. Buyers and sellers are in a temporary balance, each waiting for the other to make a move. When this tension finally breaks, it often results in a strong breakout in either direction.
Inside Bars are most common during strong uptrends or downtrends. They serve as a short pause in price movement, like the calm before the storm, giving traders time to prepare for the next significant move.
Why Traders Pay Attention to Inside Bars
Traders love Inside Bars because they provide clear visual clues about market sentiment. They can represent a pause before a continuation of the trend or even signal a potential trend reversal.
When the market has been trending strongly in one direction, and an Inside Bar appears, it often indicates that traders are taking a breather. This short period of indecision can either lead to a continuation of the existing trend or mark the beginning of a reversal.
Therefore, learning how to identify and interpret Inside Bars can help traders anticipate breakouts, plan entries and exits, and manage risk more effectively.
Understanding the Psychology Behind Inside Bars
The Inside Bar pattern is not just a visual signal; it also reflects the psychology of the market. During the formation of an Inside Bar, neither buyers nor sellers are able to push the price beyond the range of the previous candle. This means the market is taking a moment to decide its next move.
Traders can view this as a signal that momentum is slowing down, but pressure is building. When a breakout finally happens—whether upward or downward—it often occurs with strong volume and sharp price movement. Recognizing this behavior allows smart traders to position themselves ahead of the next wave.
Identifying Inside Bars Using the Smart Karobaar App
For NEPSE traders, manually identifying candlestick patterns across dozens of charts can be time-consuming. This is where the Smart Karobaar App comes in. The app uses advanced algorithms to analyze both historical and real-time data, automatically identifying key candlestick patterns, including Inside Bars.
Pattern Recognition
The app continuously scans market data to detect Inside Bar formations across different stocks. Each Inside Bar is clearly highlighted, allowing you to spot them instantly without scrolling through multiple charts.
Alerts and Notifications
You can set up personalized alerts for specific stocks. Whenever an Inside Bar pattern appears, the app sends you an instant notification. This feature ensures you never miss potential trading opportunities.
In-Depth Analysis
The Smart Karobaar App doesn’t just show you the pattern—it also provides detailed insights such as historical performance, pattern reliability, and trend context. This allows traders to understand how effective the Inside Bar pattern has been for a particular stock or sector.
Customizable Filters
The app also allows traders to filter Inside Bars by volume, timeframe, or sector. This customization ensures that you focus only on the patterns that match your trading strategy, making your analysis efficient and targeted.
Why the Inside Bar Pattern is Important
The Inside Bar is more than just a chart formation; it’s a strategic tool that helps traders identify entry and exit points, confirm trend reversals, and manage risk effectively. Let’s explore how.
1. Entry and Exit Points
Inside Bars are excellent for timing trades. When the price breaks above the high of the mother bar, it can signal a bullish breakout. Conversely, if the price breaks below the mother bar’s low, it can signal a bearish move. The Smart Karobaar App makes this process simple by marking breakout points visually, helping traders take timely actions.
2. Confirmation of Trend Reversals
After a long uptrend or downtrend, an Inside Bar may signal that the existing momentum is fading. If the breakout happens in the opposite direction of the previous trend, it often indicates a reversal. Using Smart Karobaar’s historical pattern data, traders can confirm whether the Inside Bar has shown reliable reversal signals in similar market conditions.
3. Risk Management
Inside Bars are especially helpful for managing risk. When spotted near key support or resistance levels, they signal caution. This gives traders time to place stop-loss orders and avoid overexposure during uncertain market phases.
It’s important to remember that Inside Bars are indicators of potential breakouts, not guarantees. The direction of the breakout can sometimes surprise traders. Therefore, always place a stop-loss order to protect your position, especially when trading around volatile zones.
Step-by-Step Guide: How to Scan Inside Bars with Smart Karobaar
Scanning Inside Bars in the Smart Karobaar App is quick and simple. Follow these steps to get started:
- Open the Smart Karobaar App on your device.
- Tap on Technical Scanner in the main menu.
- Select the Volatility section from the scanner options.
- Choose Inside Bar from the pattern list.
- The app will instantly display all the Inside Bar formations across NEPSE-listed stocks.
You can then view details such as the stock name, timeframe, and pattern type, helping you make faster trading decisions with complete confidence.
Practical Tips for Trading Inside Bars
To make the most of Inside Bar signals, consider the following practical trading tips:
- Always check the trend direction before acting on an Inside Bar. Inside Bars that form in the direction of the main trend are more reliable.
- Look for high-volume breakouts. Strong volume adds confirmation that the breakout is genuine.
- Use multiple timeframes. Checking Inside Bars on daily, weekly, and intraday charts can give a clearer picture of market structure.
- Avoid trading during low liquidity periods, as false breakouts are common.
By combining these strategies with Smart Karobaar’s insights, traders can improve accuracy and confidence in their trades.
Why Choose Smart Karobaar for Your Trading Journey
The Smart Karobaar App is built to make trading in NEPSE simpler, smarter, and more data-driven. Its intelligent scanning features, real-time alerts, and easy-to-use interface make it a must-have tool for anyone serious about trading.
Whether you are a beginner learning technical analysis or an experienced trader refining your strategy, Smart Karobaar gives you the analytical edge you need to stay ahead of the market.
Start Scanning Inside Bars Today
Understanding and applying the Inside Bar pattern can significantly enhance your trading results. With the Smart Karobaar App, you can identify these setups effortlessly and take informed actions at the right time.
Open the app, scan for Inside Bars, and start making smarter trading decisions backed by data and precision.
Click here to download the Smart Karobaar App and begin your journey toward confident and strategic trading today.
Leave a Reply