One of the most common questions investors ask is: Which month gives the highest returns in NEPSE?
To answer this, our research team analyzed 28 years of NEPSE data (1997–2024), focusing specifically on the month of July. Our goal was to see whether July has a seasonal effect on the Nepal Stock Exchange (NEPSE) and to predict what might happen in July 2025.
July’s Track Record: 71.4% Positive Returns
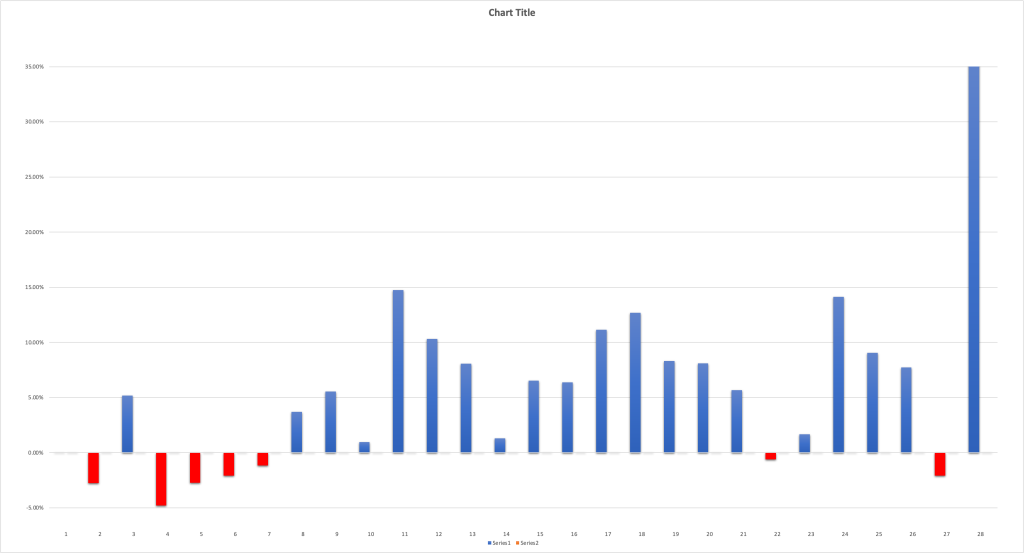
We analyzed NEPSE’s July performance over 28 years. Here’s what we found:
- ✅ 20 years → Positive returns
- ❌ 7 years → Negative returns
- ➖ 1 year → No change (0%)
That means NEPSE has risen in July 71.4% of the time.
Step 1: The Data We Used
We collected NEPSE’s monthly July closing values from 1997 to 2024. From this, we calculated the percentage change for July each year using the formula: % Change=Close – OpenOpen×100\% \, \text{Change} = \frac{\text{Close – Open}}{\text{Open}} \times 100%Change=OpenClose – Open×100
This gave us 28 data points (one July return per year).
Step 2: Descriptive Statistics (Understanding the Data)
To summarize the 28 years of July data, we calculated the following metrics:
| Metric | Formula / Explanation | Value |
|---|---|---|
| Mean | Average of all July % returns | 5.74% |
| Median | Middle value when July % returns are sorted | 5.62% |
| Std Dev | Standard deviation (volatility) of July returns | 0.08 (≈ 8%) |
| Min | Smallest July % return | –4.79% |
| Max | Largest July % return | +35.53% |
| Down Years | Number of negative Julys | 7 |
| Up Years | Number of positive Julys | 20 |
What this tells us
- On average, NEPSE rises 5.74% every July.
- The distribution is fairly balanced, with a median close to the mean (5.62%), showing consistency.
- The standard deviation of 8% means July can be volatile — some years big gains, some small losses.
- The worst July gave a –4.79% loss, while the best July saw a +35.53% surge.
- Importantly, 20 out of 28 Julys were positive (71.4%), showing a strong seasonal bias.
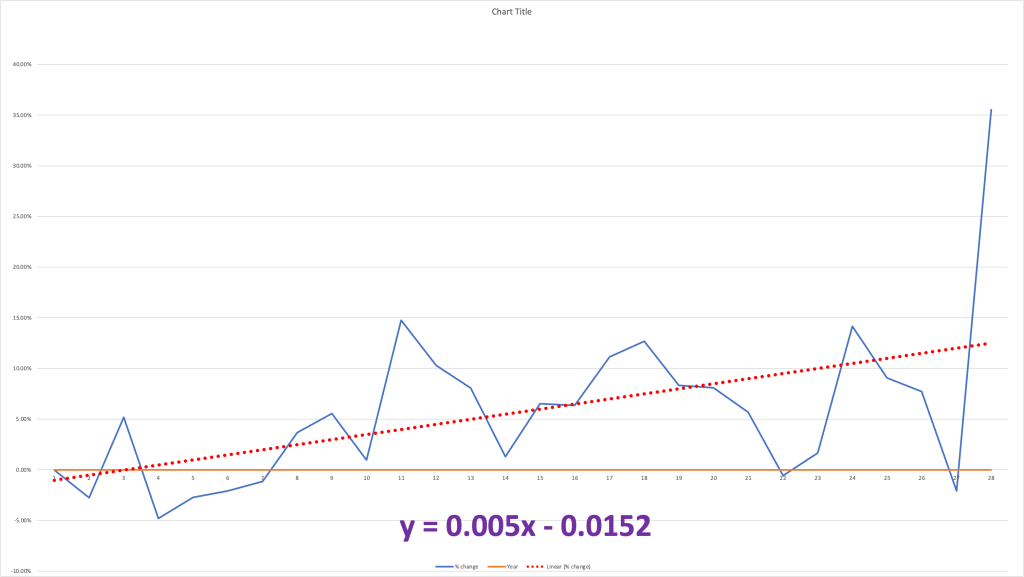
Trend Analysis: Is July Getting Stronger?
We plotted July returns over time and found a positive trendline with a slope of 0.005.
This suggests that July returns are improving over the long term.
The regression model predicts a 12.98% return for July 2025.
Step 3: Analytical Techniques
We used four forecasting approaches to estimate NEPSE’s likely performance in July 2025:
- Mean-Based Method
- Assumes July 2025 will deliver the historical average return.
- Formula: Predicted Index=Baseline Index×(1+Mean Return)\text{Predicted Index} = \text{Baseline Index} \times (1 + \text{Mean Return})Predicted Index=Baseline Index×(1+Mean Return)
- Standard Deviation (SD) Range
- Uses mean ± 1 standard deviation to create a “typical range” (about 68% probability).
- Formula: Range=Baseline Index×(1+(Mean±SD))\text{Range} = \text{Baseline Index} \times (1 + (\text{Mean} \pm \text{SD}))Range=Baseline Index×(1+(Mean±SD))
- Regression Slope
- Fits a trend line through July returns (1997–2024) and extends it to 2025.
- Formula: y^=a+b⋅t\hat{y} = a + b \cdot ty^=a+b⋅t where aaa = intercept, bbb = slope, ttt = year.
- From our data: slope = 0.0050, intercept = –10.0016.
- Predicted July 2025 return = 12.98%.
- Regression + Standard Error (SE)
- Builds a confidence interval around the regression forecast to reflect uncertainty.
Step 4: Forecast Results
We used NEPSE’s July 2024 closing index as a baseline (≈ 2,629.47). Plugging into each model, we get:
| Method | Growth | Closing | Range |
|---|---|---|---|
| Mean-Based | 5.74% | 2,782.53 | – |
| SD Range (68%) | – | – | 2,571.68 – 2,994.36 |
| Regression Slope | 12.98% | 2,973.36 | – |
| Regression + SE | – | – | 2,566.50 – 3,379.00 |
Step 5: Interpretation
- Mean-Based: Suggests a modest rise, consistent with the long-term July average.
- SD Range: Shows the most likely “typical” fluctuation, capturing both upside and downside possibilities.
- Regression Slope: Indicates a stronger upward trend, forecasting a 12.98% gain, leading to a closing of ~2,973.36.
- Regression + SE: Provides a wider safety band — from 2,566.50 to 3,379.00 — to account for uncertainty.
Conclusion
Based on 28 years of July performance in NEPSE, our research team concludes that:
The Regression Slope method provides the most reliable prediction.
- Expected Growth (July 2025): 12.98%
- Predicted Closing Index: ~2,973.36
This suggests that July continues to be a statistically favorable month for NEPSE investors, though risks and uncertainty remain. As always, investors should combine this seasonal insight with market fundamentals, liquidity conditions, and risk management before making decisions.
Key Takeaways
- July has been positive 71.4% of the time since 1997.
- Average return: 5.74%; best return: +35.53% (2024).
- Regression analysis suggests July’s strength is increasing.
- July 2025 prediction: ~12.98% growth, closing near 2,973.
⚠️ Remember: Past performance is not a guarantee. Always consider market liquidity, volume, and risk before investing.
Disclaimer
This analysis is based on historical NEPSE data from 1997–2024. It is intended for educational purposes only and is not financial advice.
Leave a Reply